01
Internal tools platform
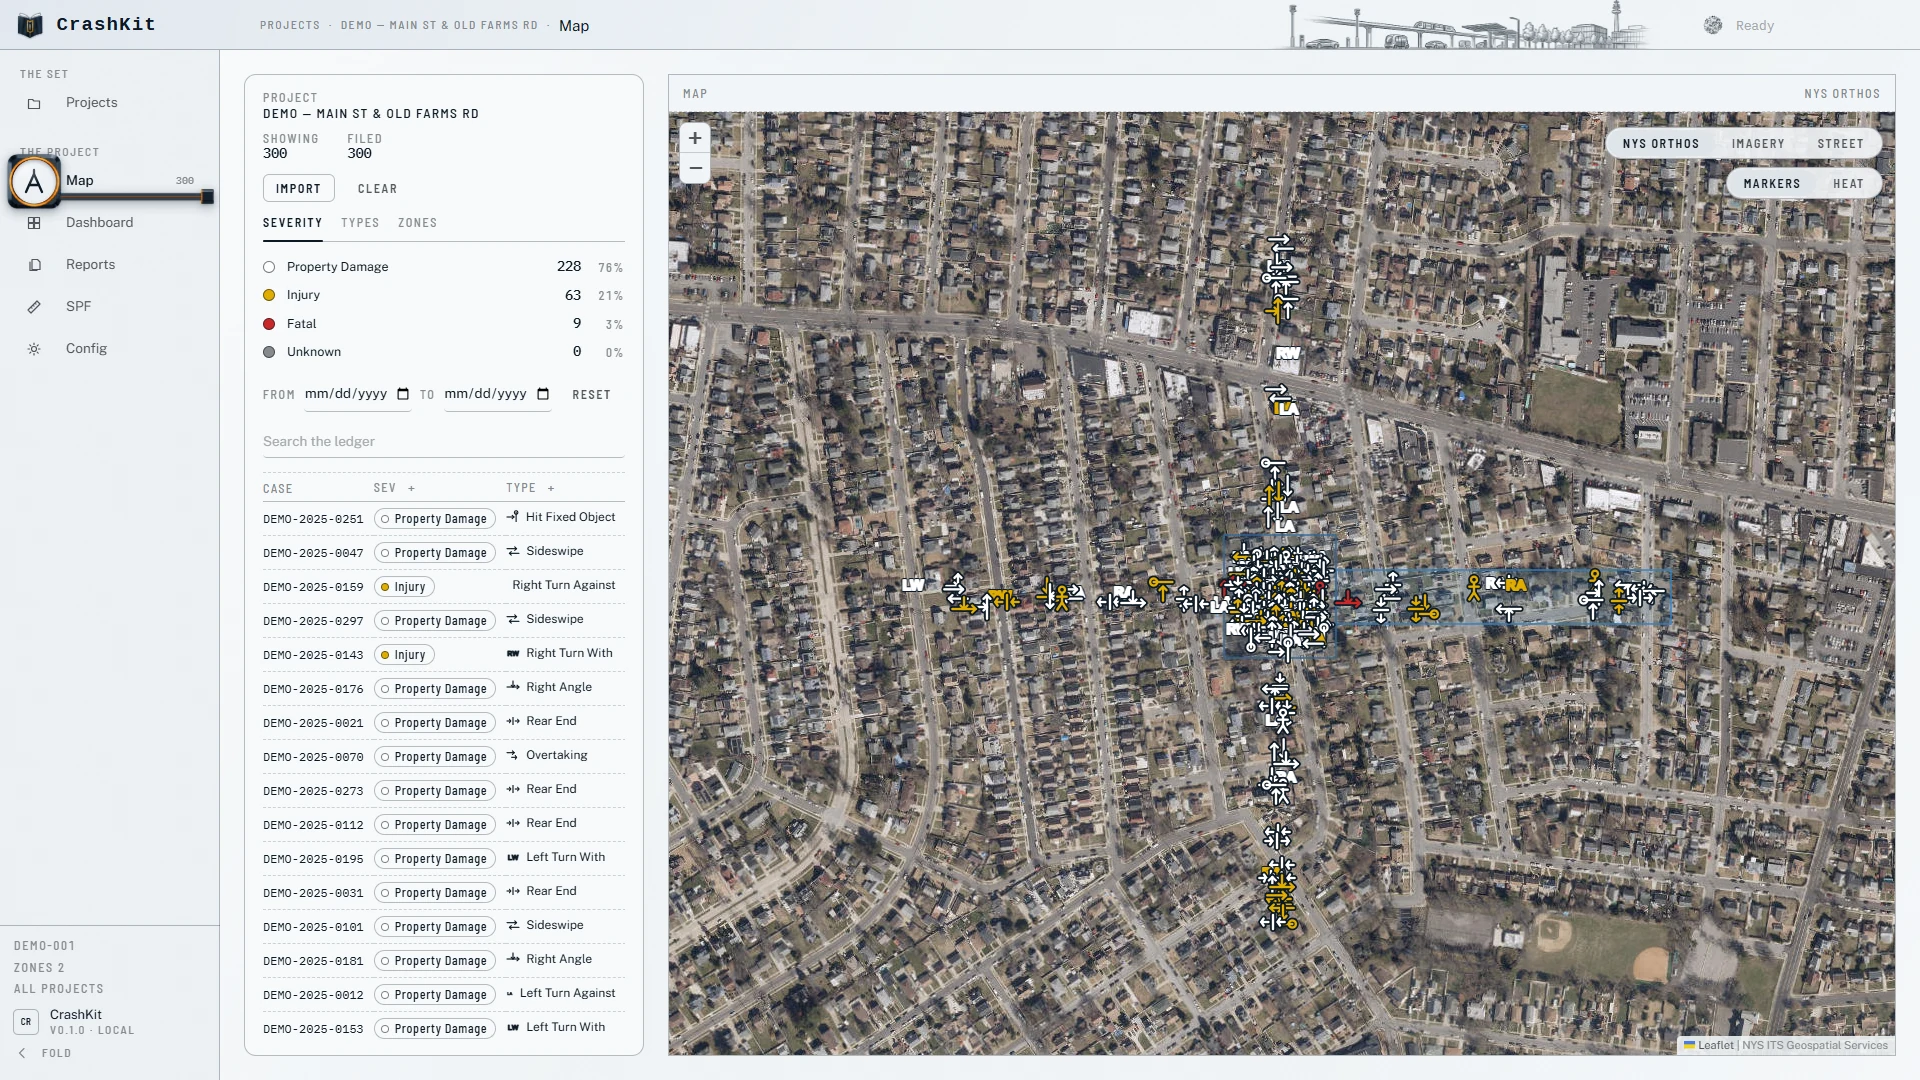
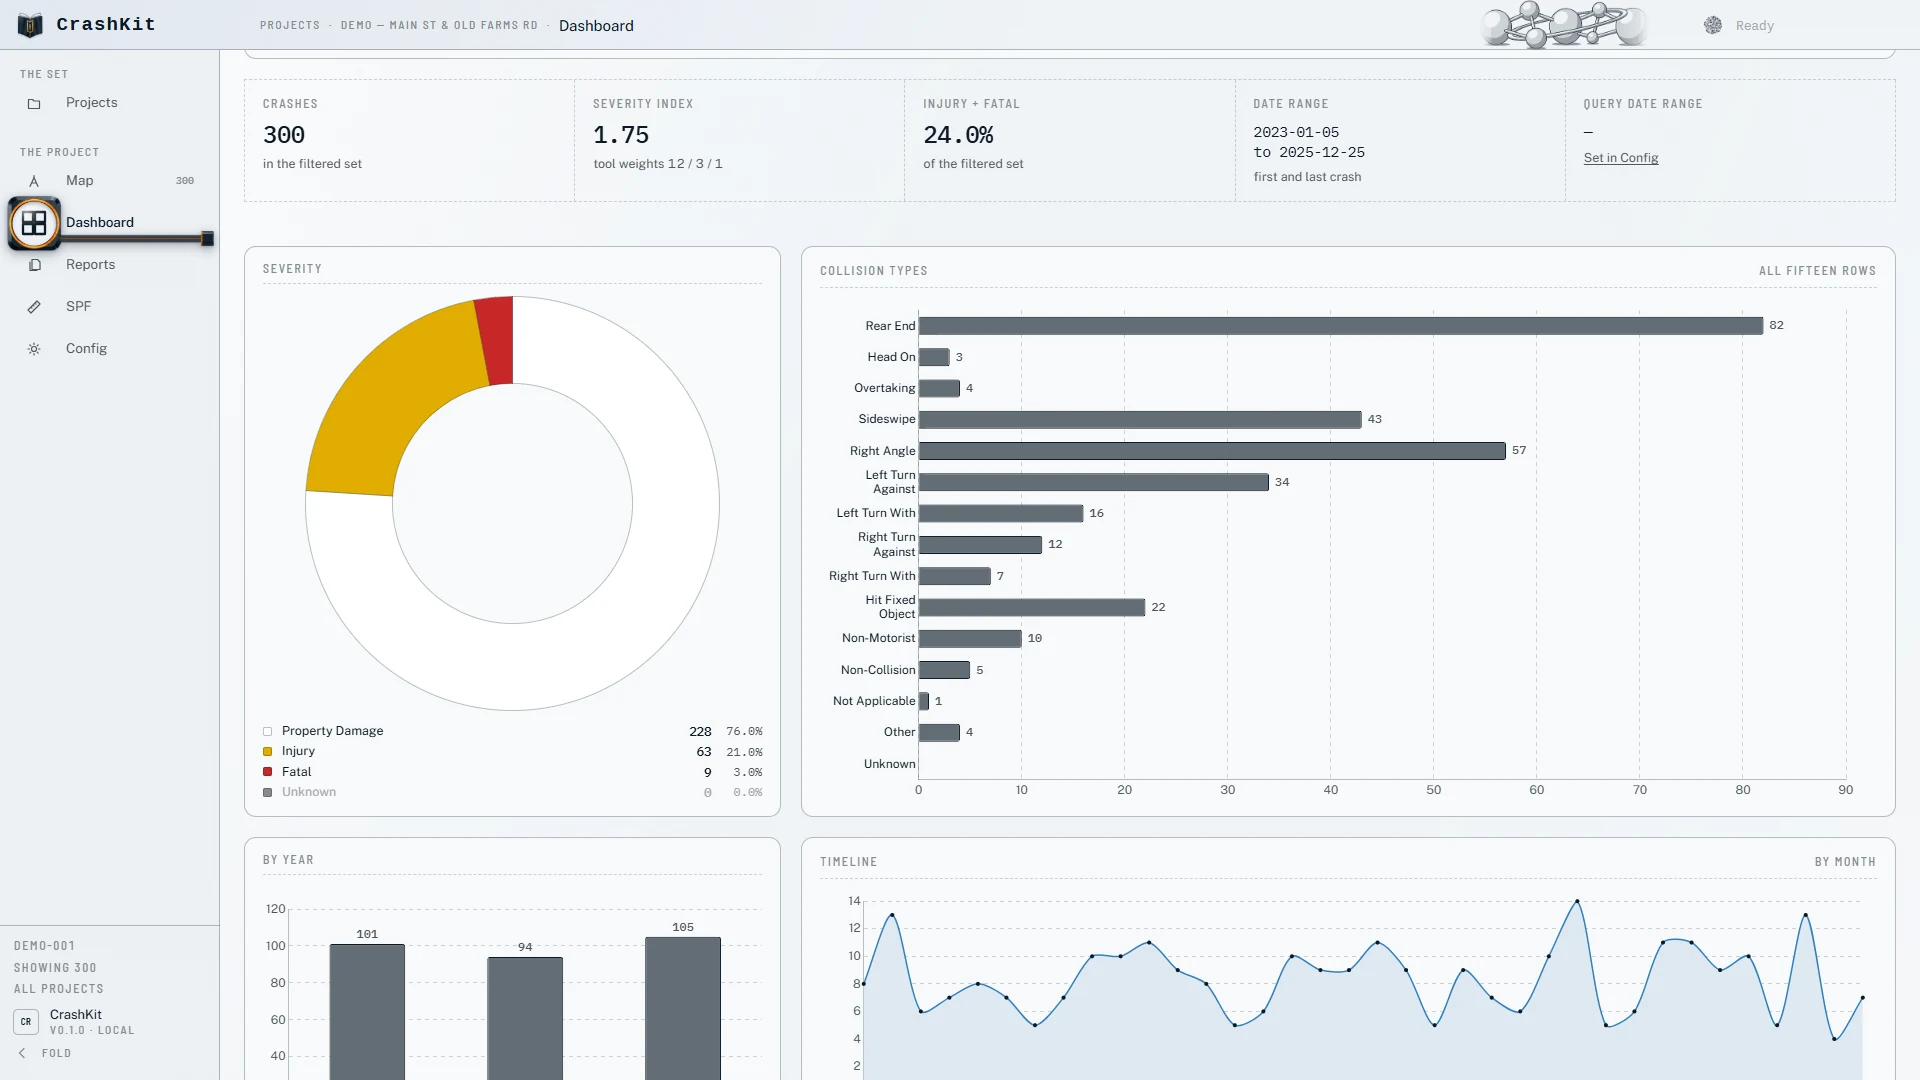
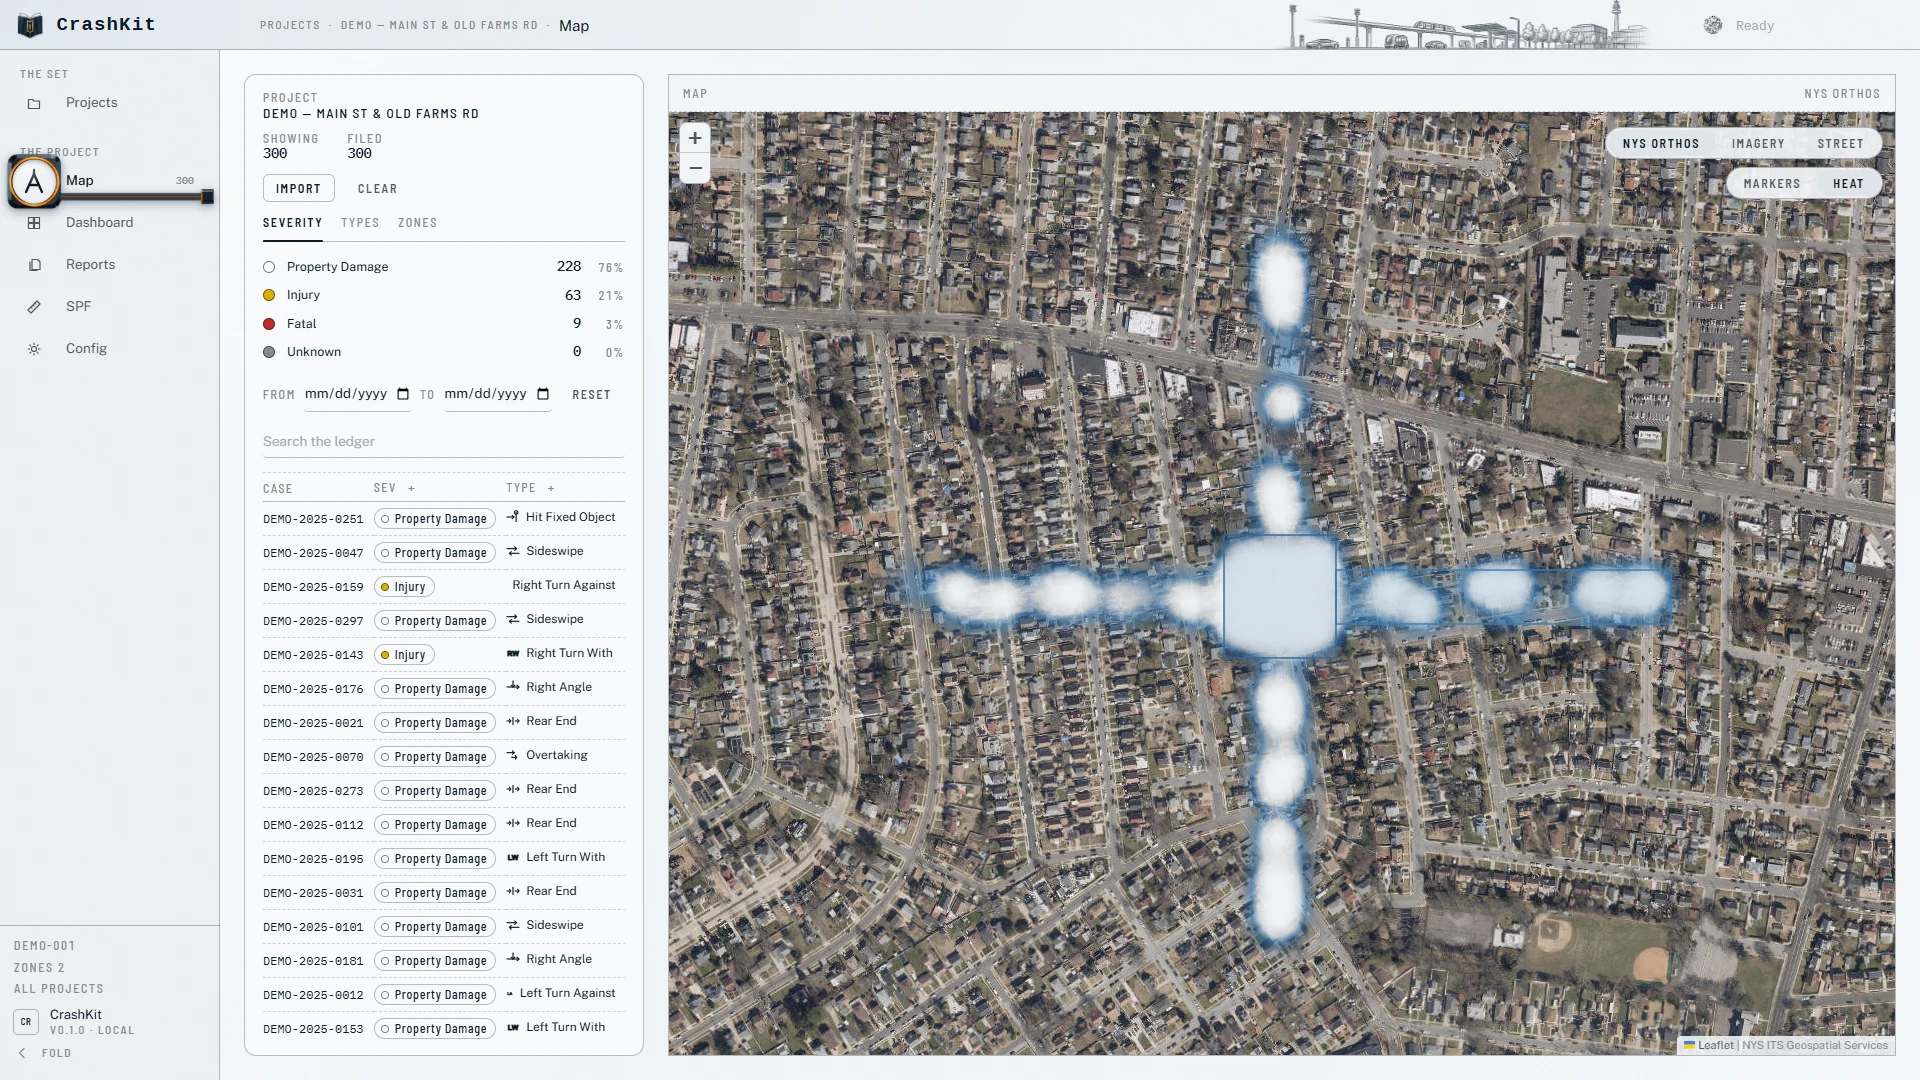
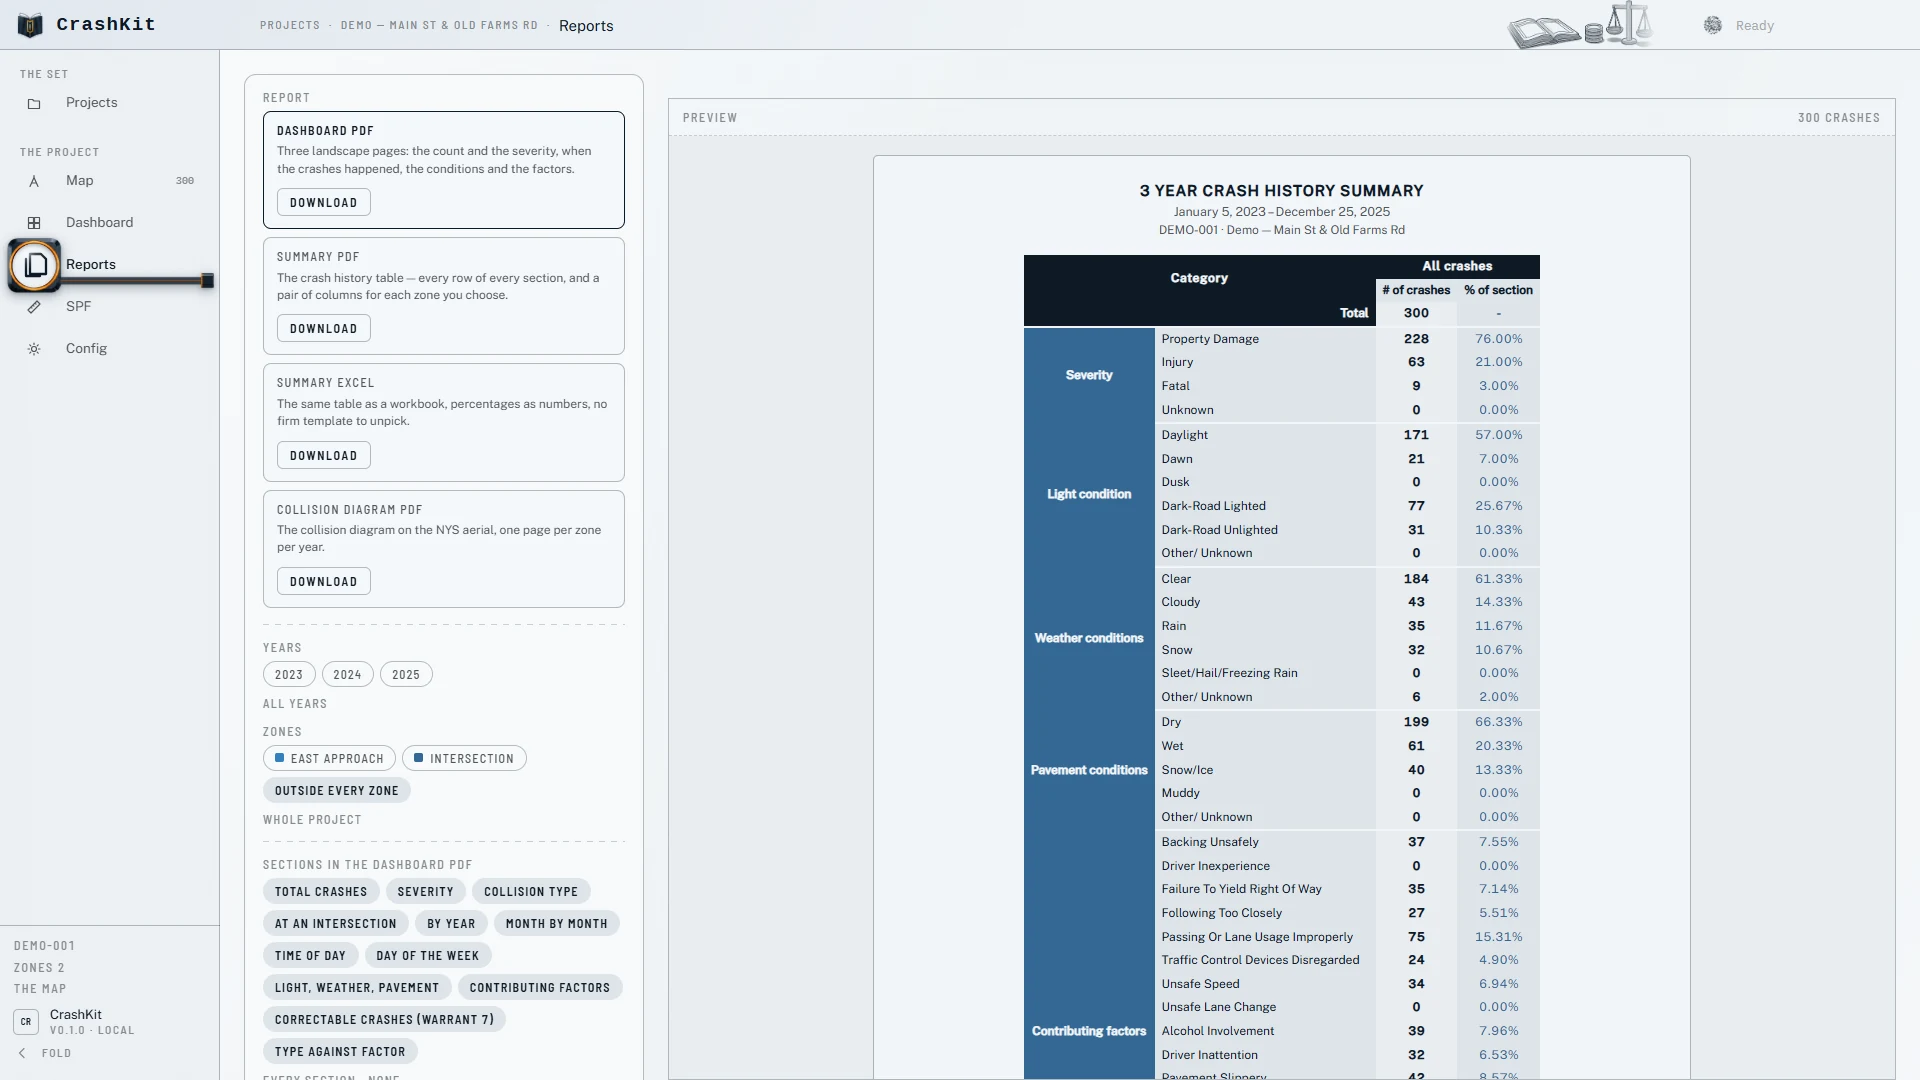
I built a shared platform for an engineering firm. Employees used department tools and built new ones with Claude Code, shared setup and IT approval.
Read more
The platform
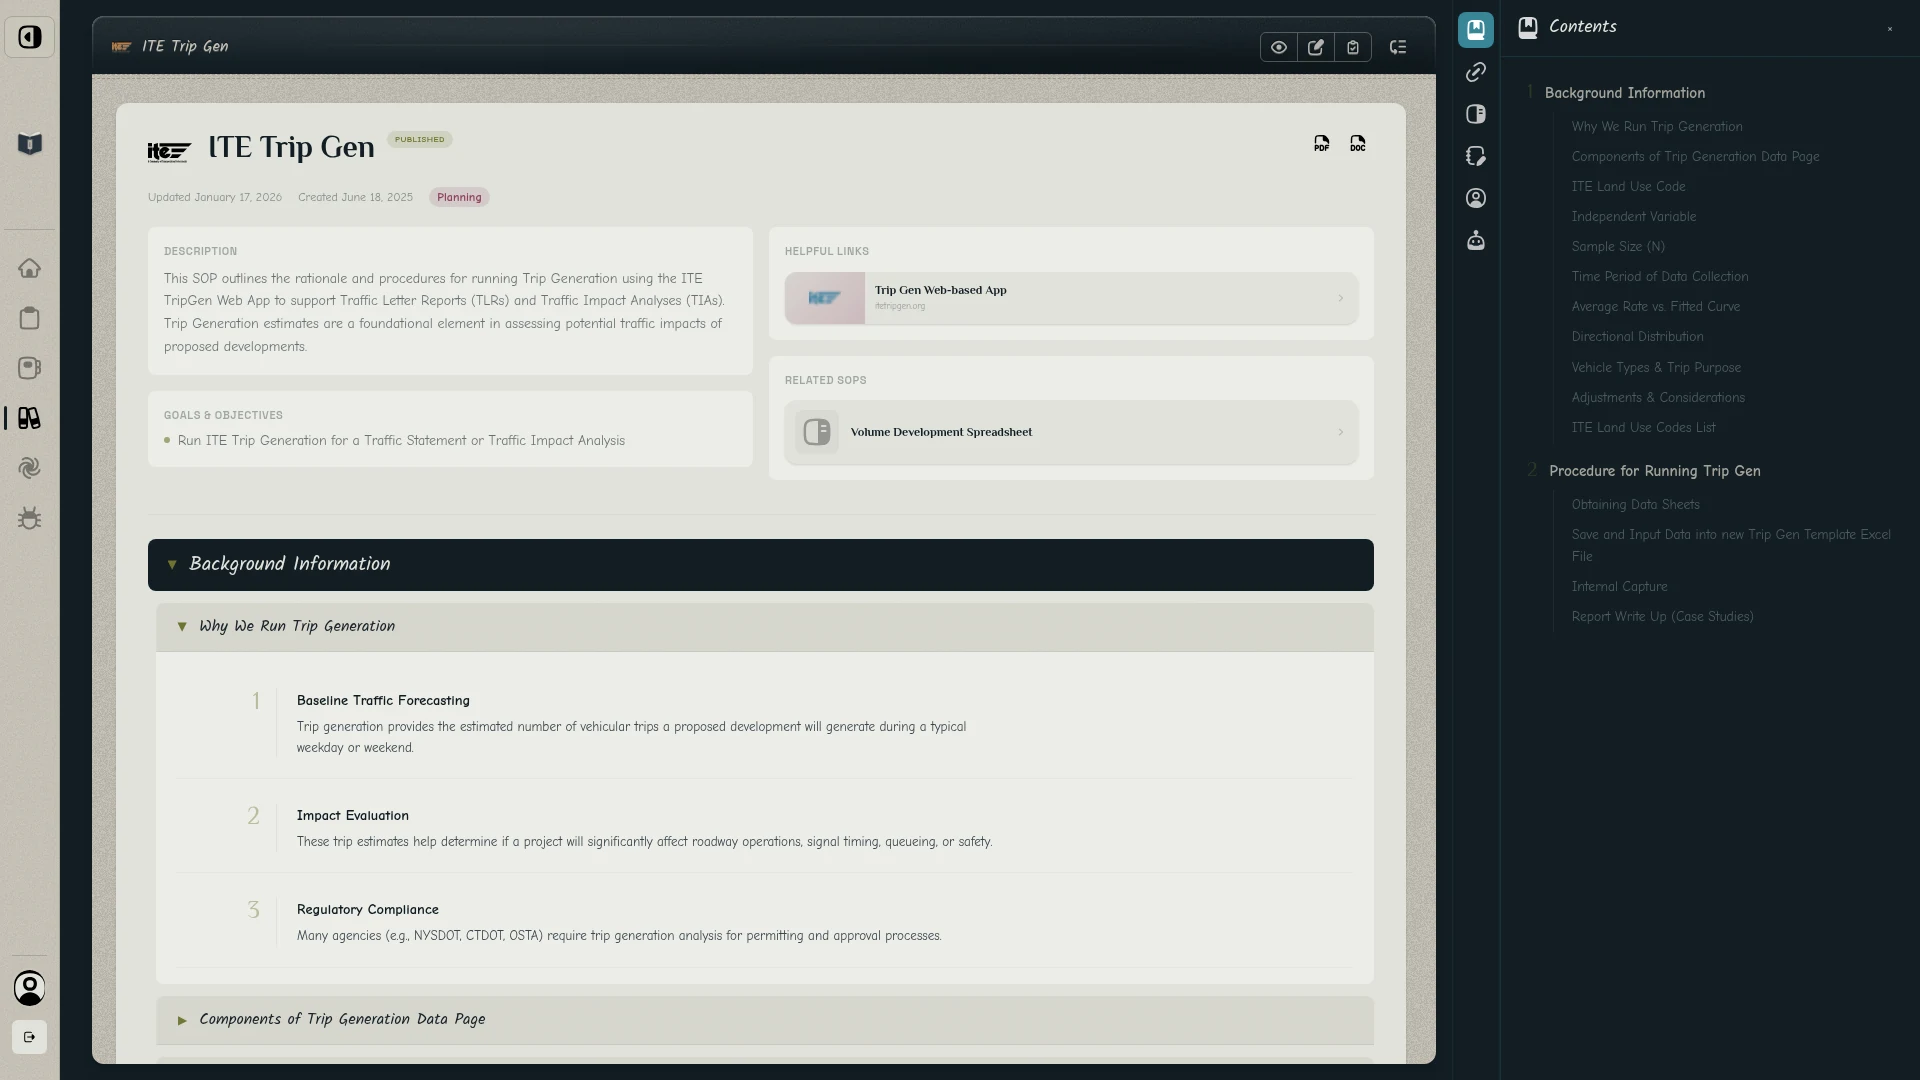
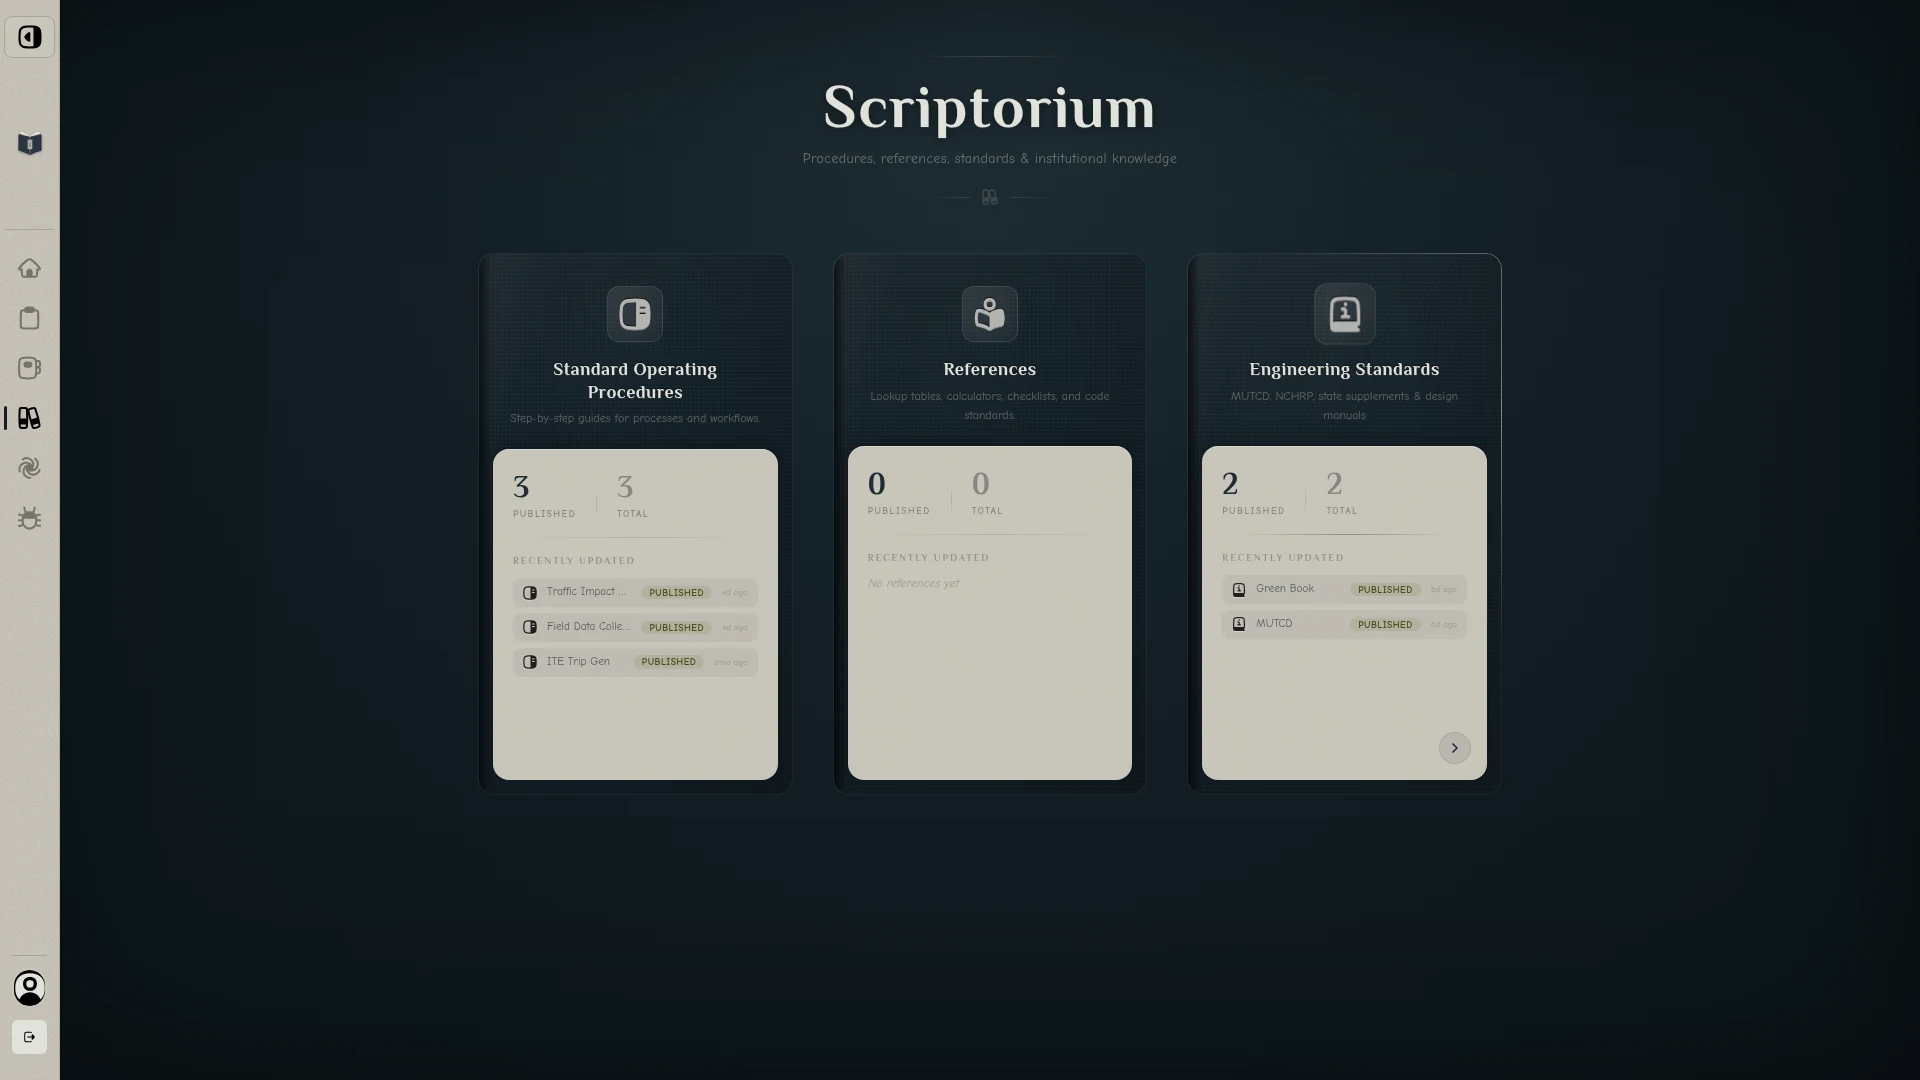
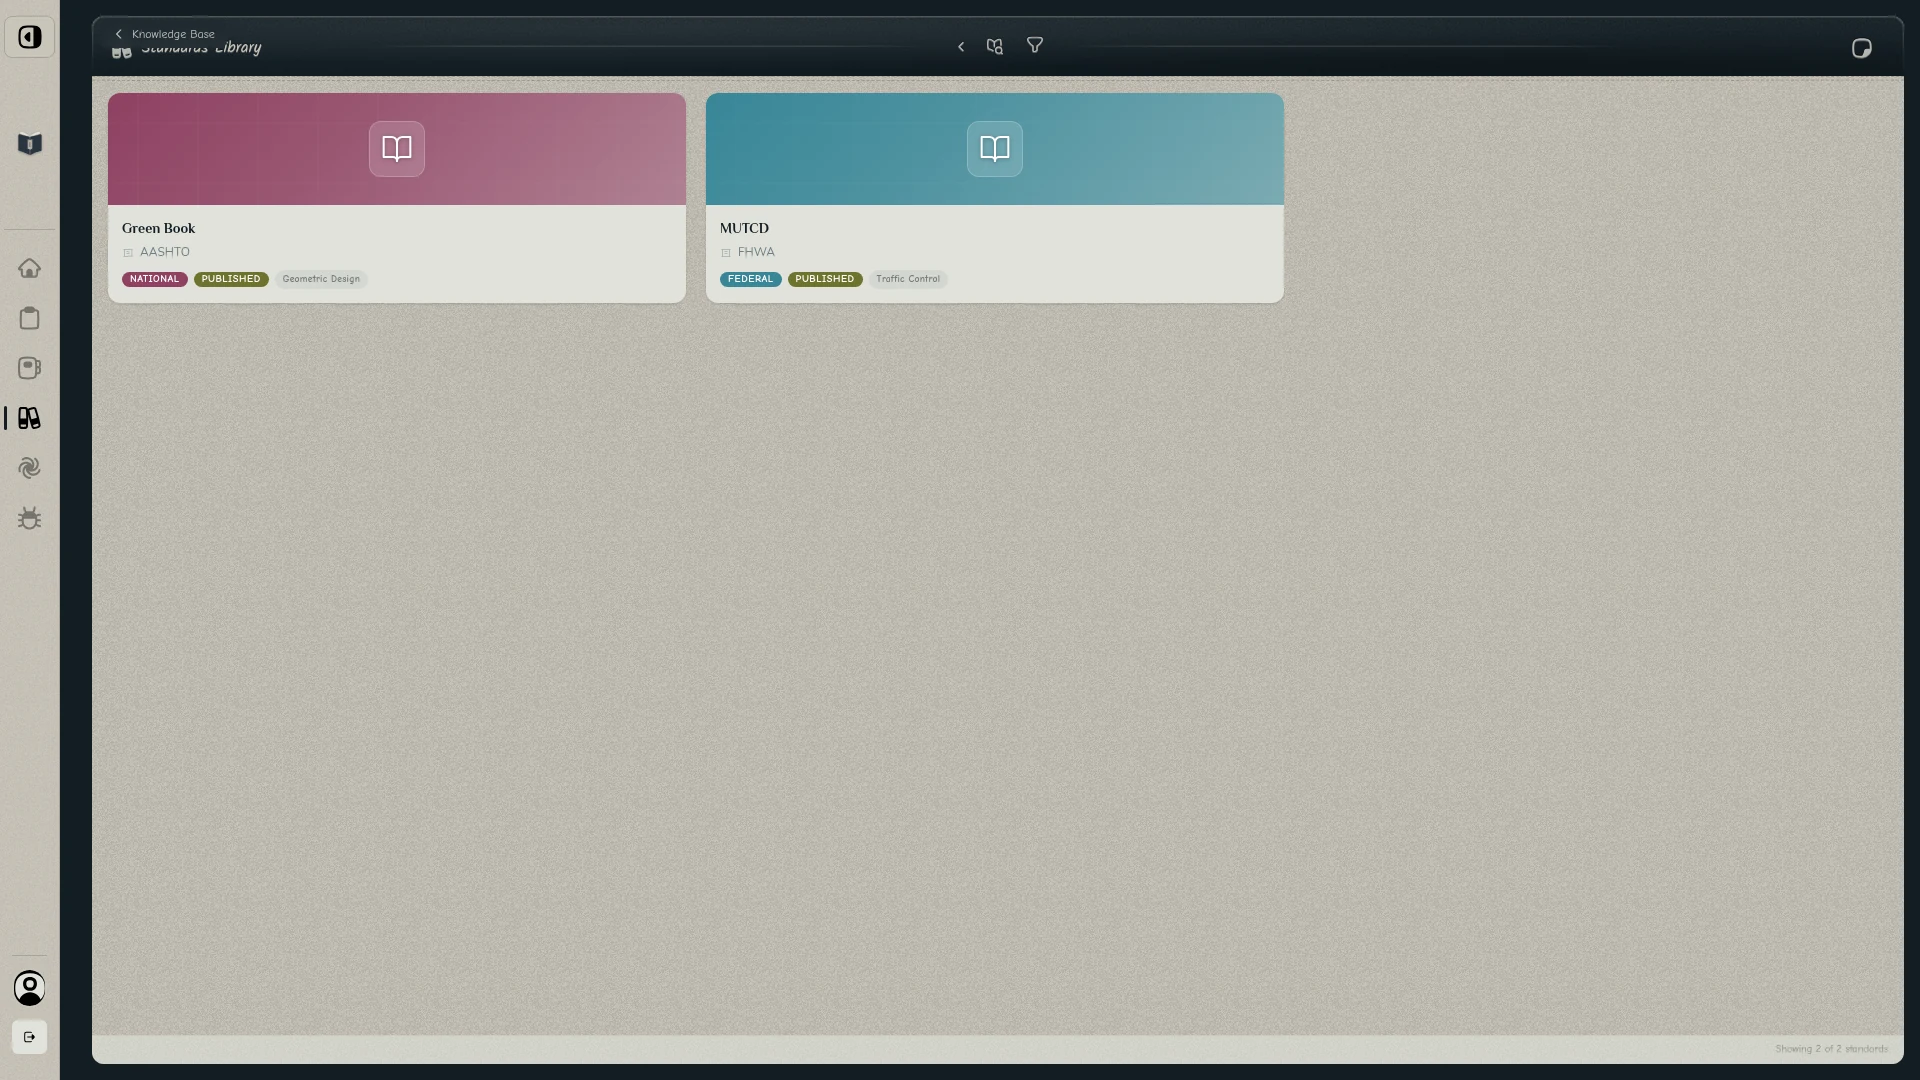
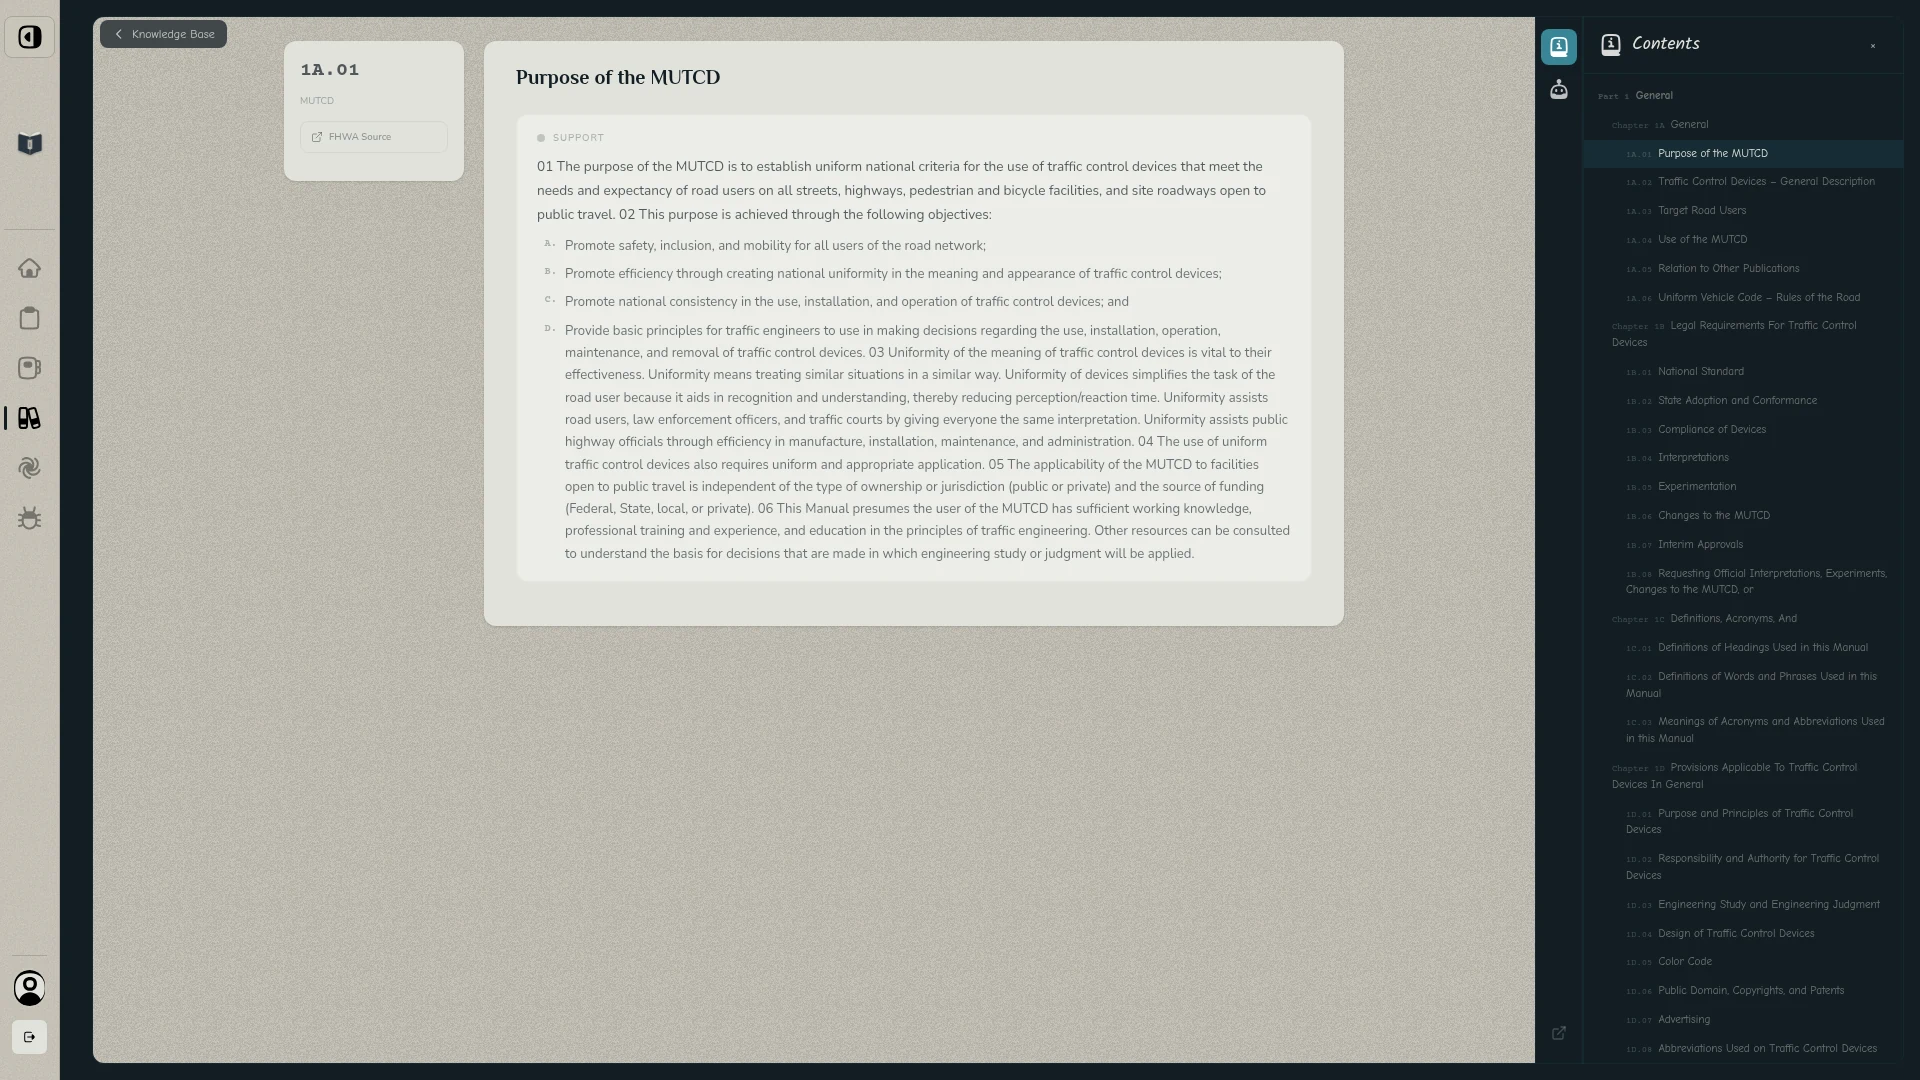
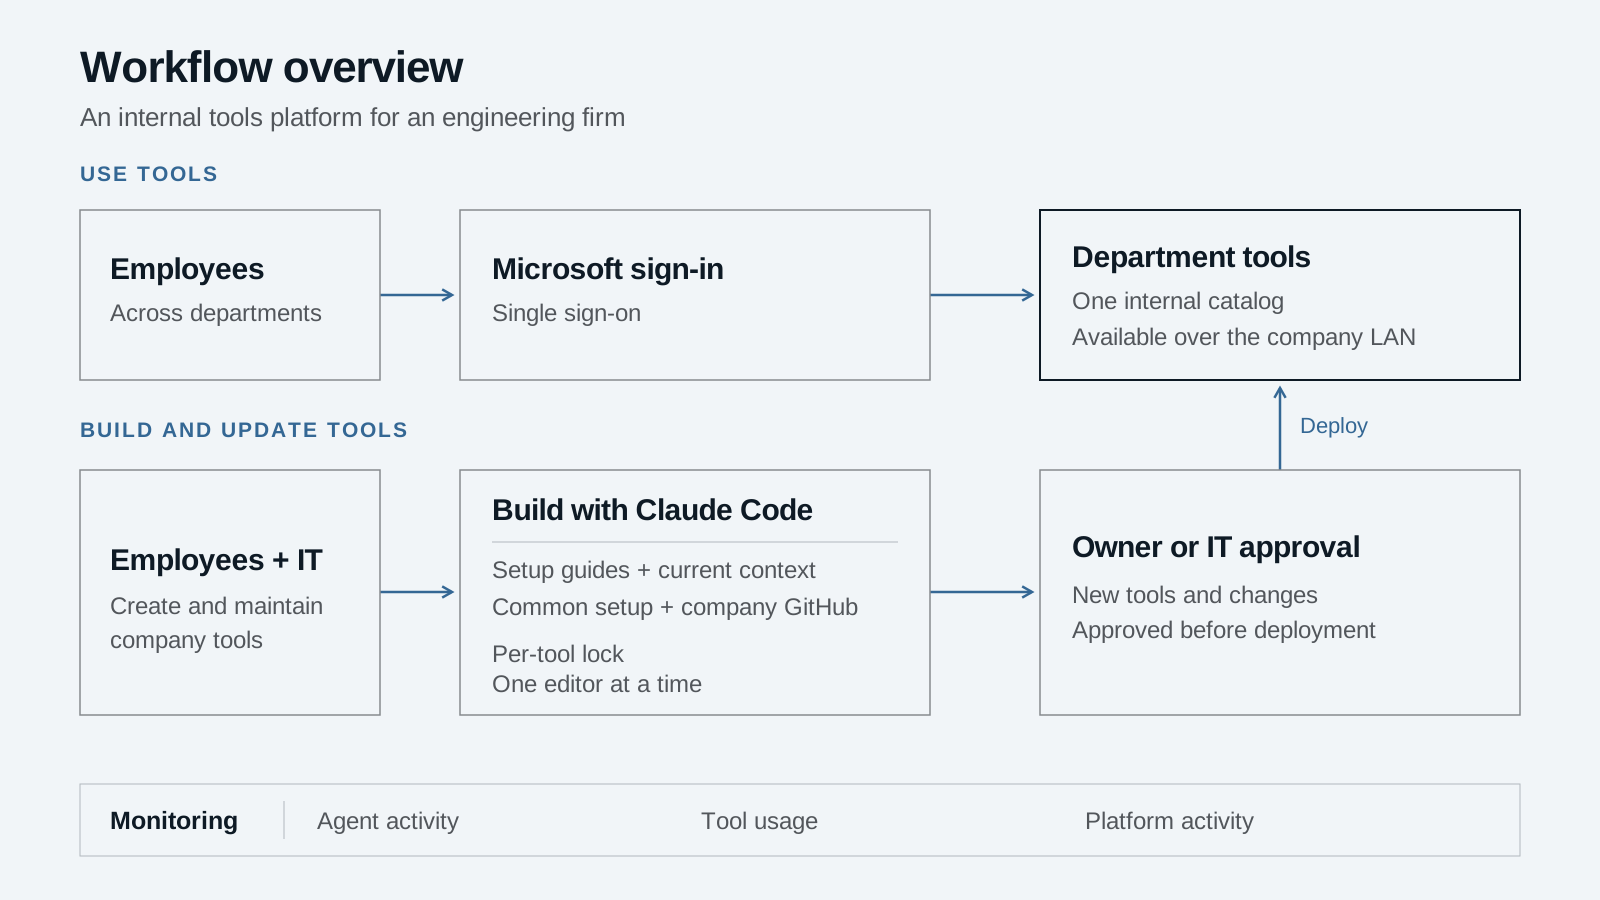
I built a centralized platform for an engineering firm that employees could access over the company's internal network. They signed in through Microsoft single sign-on and found tools organized by department. I built several of those tools, including a program that compiled Synchro report data into tables.
The platform also gave employees a way to start building their own tools with Claude Code. I wrote setup guides and taught IT staff how to use it. Their agents automatically received current information about the platform, the existing tools, and how to set up a new tool. Common setup work was already built into the platform, and the work went through the company's GitHub.
I added a locking system so two people could not work on the same tool at the same time. Creating a new tool required approval from me or IT. Deploying changes to an existing tool also required approval. The platform included monitoring for Claude Code activity, tool usage, and other aspects of platform operation.
IT staff used the system to build and deploy tools of their own. The guides and shared context helped them learn how to work with AI agents while following the platform's setup and approval process.
Example: Synchro report tables
Engineers were manually copying data from Synchro reports into tables for their reports. I built a tool that read the exported PDFs and populated those tables using deterministic code. The data transfer did not use an AI model.
Different offices needed different table formats. Pennsylvania and New York staff, for example, prepared tables differently for their respective state DOTs. I built a table studio where users could define how values from the source report mapped to their table format.
The tool showed a table preview beside a PDF viewer. Clicking a table cell highlighted the source value in the PDF so an engineer could check where it came from. The tool flagged some problems, but the checks did not catch everything. Engineers remained responsible for reviewing the result. The source links also made it easier to investigate a value that looked wrong, including a possible error in the original Synchro work.
Example: Observed trip generation
For a transportation management plan at UBS Arena, traffic counts were collected at roughly eight to ten entrances and exits during hockey games and concerts. The counts came from automatic traffic recorders or video cameras. I built a tool to compile the collected counts for the event analysis.
The tool used event start and end times to define the analysis windows. It identified the highest entering and exiting volumes and the peak hours within those windows, then generated tables for our reports.