
Crash mapping
Imports crash records and maps them by collision type, severity, and zone.
Case study · Software development
A workspace for DOT crash records, zone-based mapping, interactive dashboards, and PDF reports.
Built by James McWilliams.
Demo job: Broadway (NY 107) at Bloomingdale Rd, Hicksville.
Crash records from NYSDOT, released under FOIL.
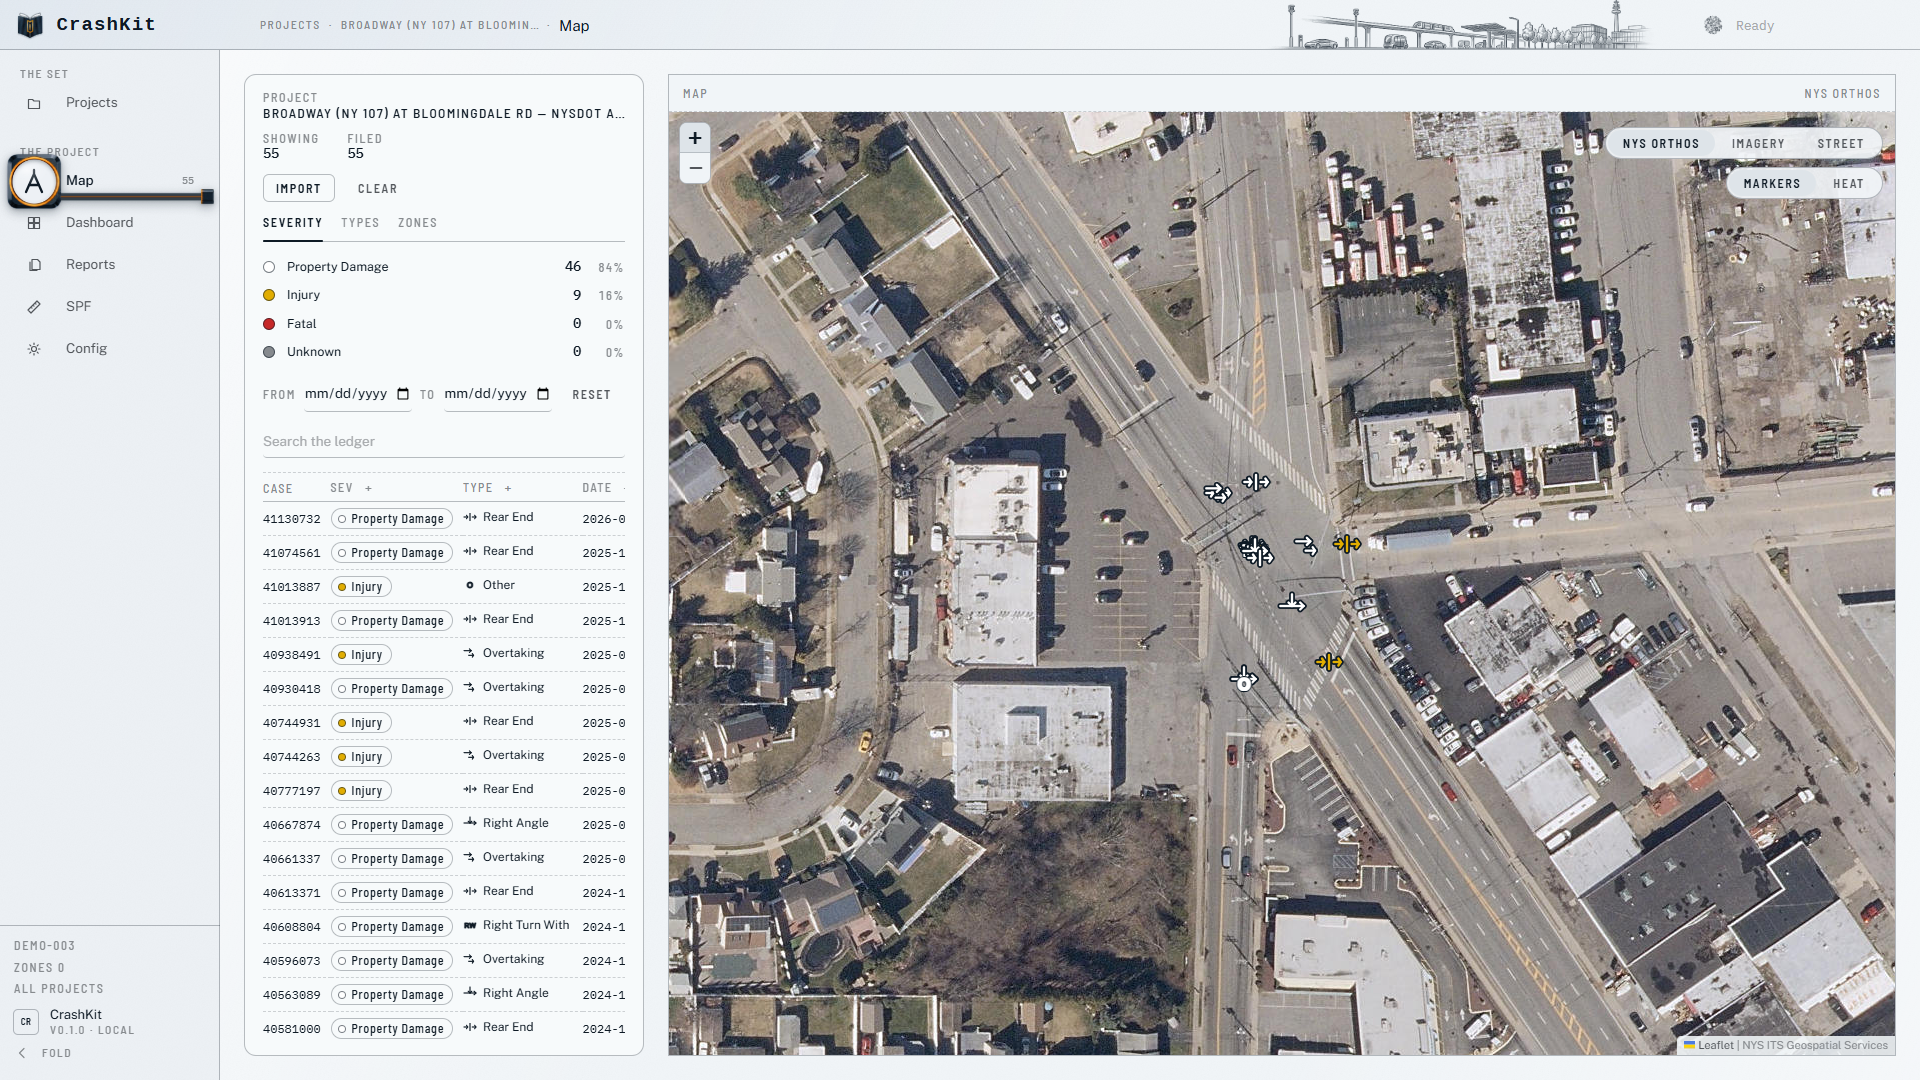
55 crashes from 2021 to 2026, each drawn as its collision type and severity.
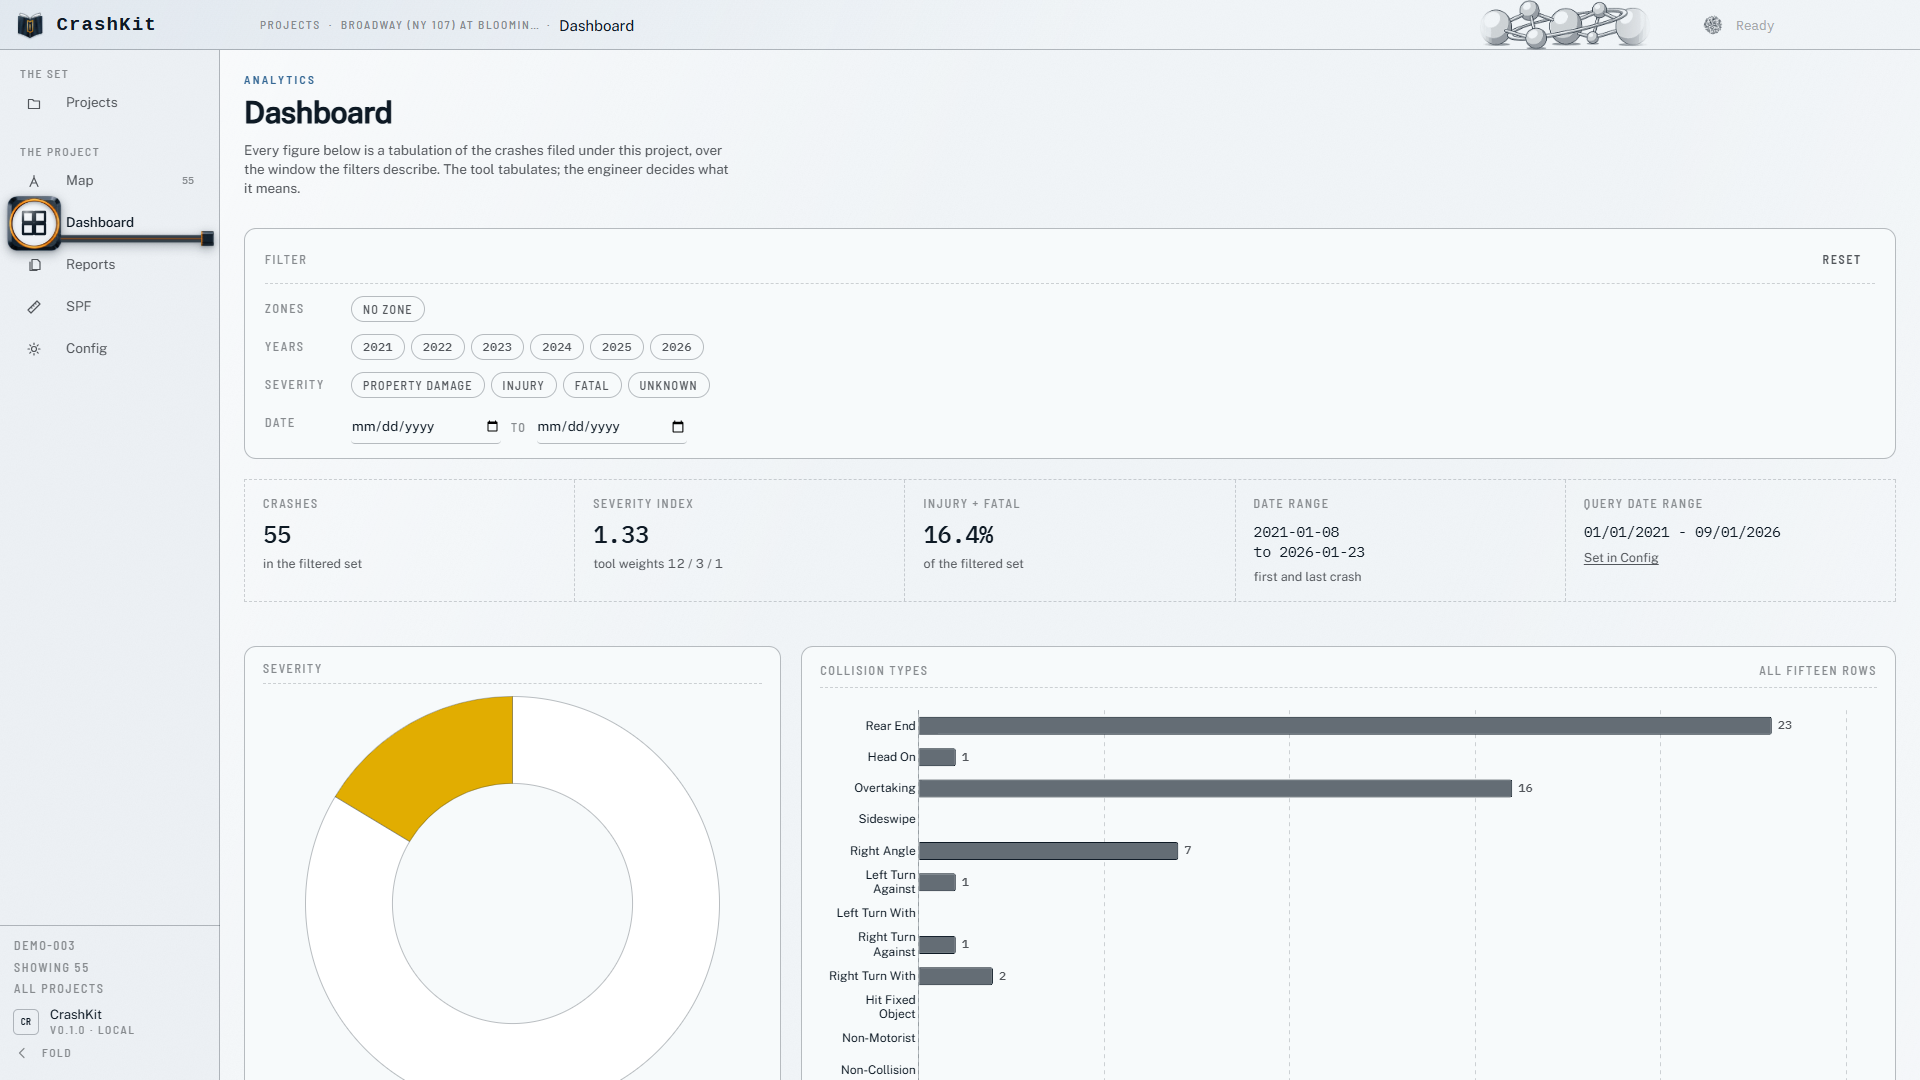
Severity, collision types, and time patterns from the same records.
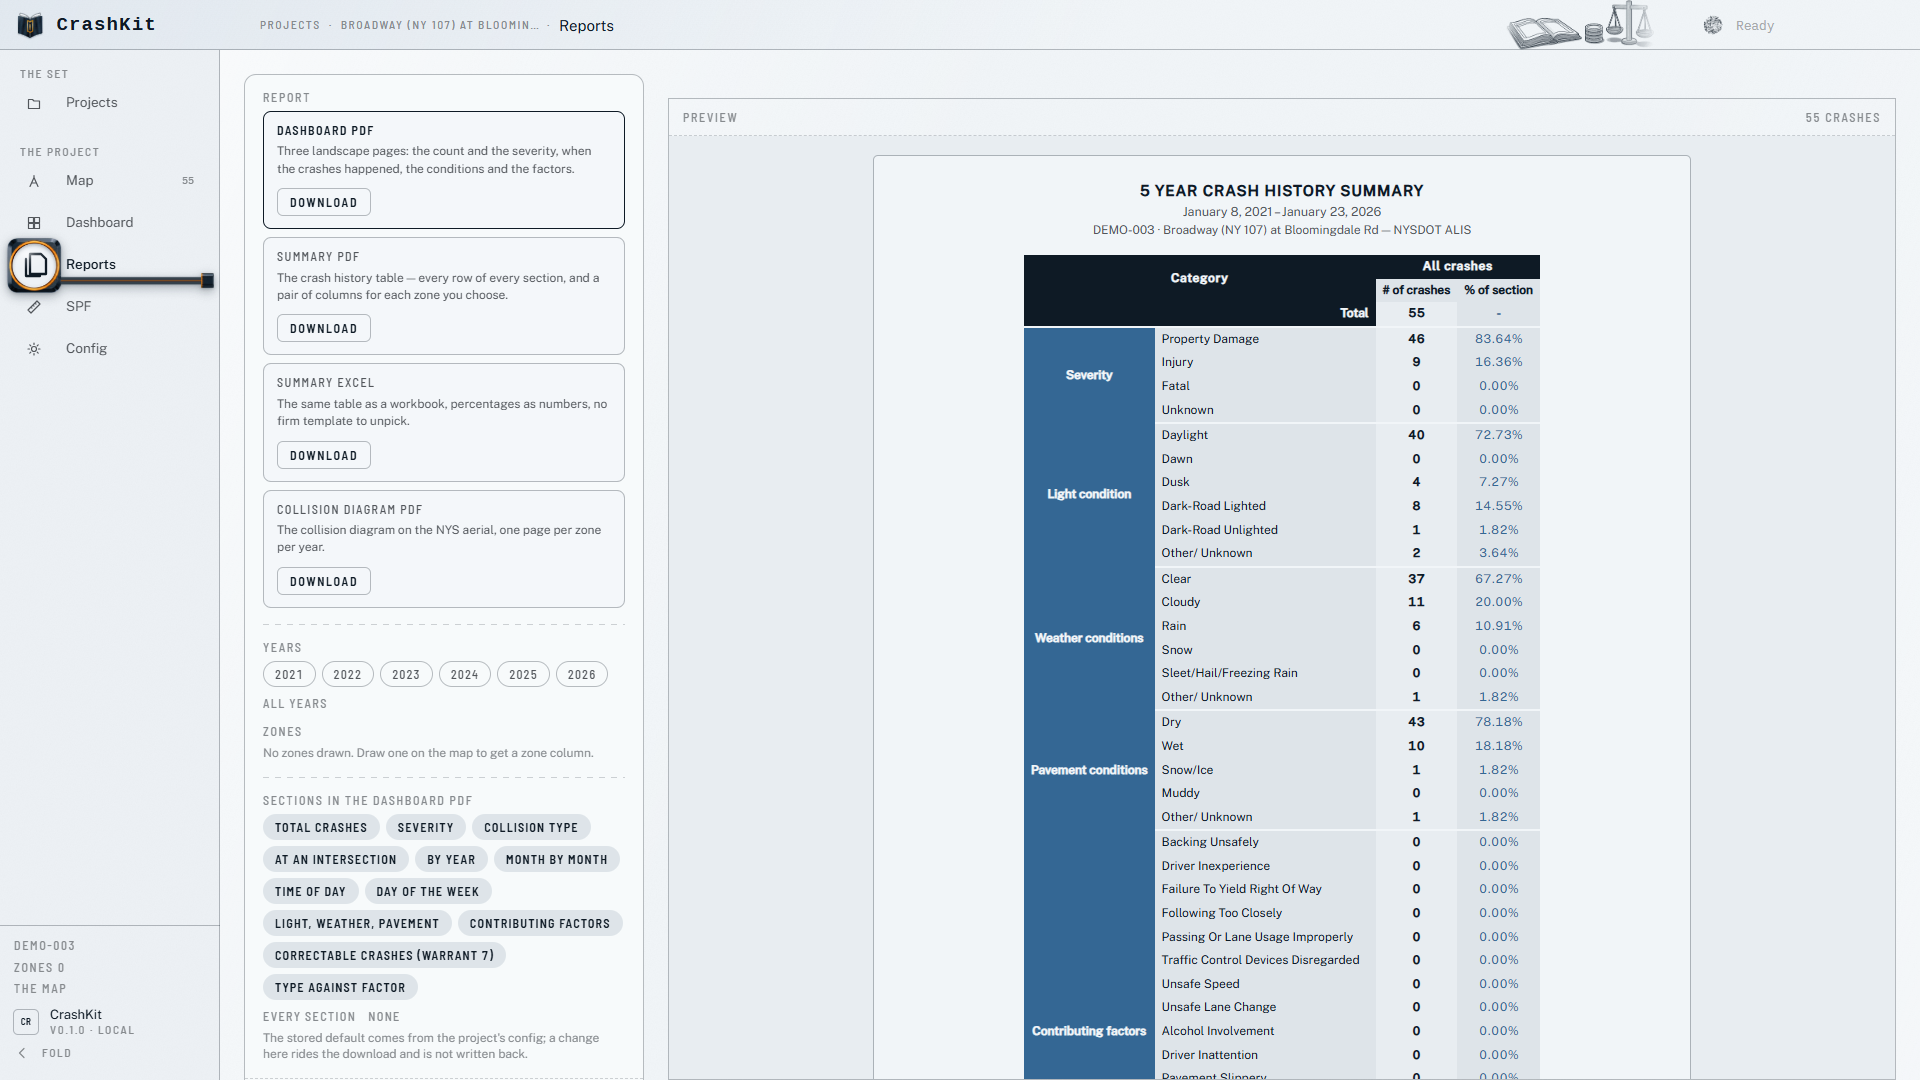
The crash history summary, with PDF and Excel outputs.
01of 03
Imports crash records and maps them by collision type, severity, and zone.
Twelve charts with filters for zones, years, severities, and date ranges.
Switch from collision symbols to a heatmap of the same crash records.
Download dashboard and crash-summary PDFs, an Excel workbook, and collision-diagram PDFs.
Have a workflow you want to improve?
Discuss a project